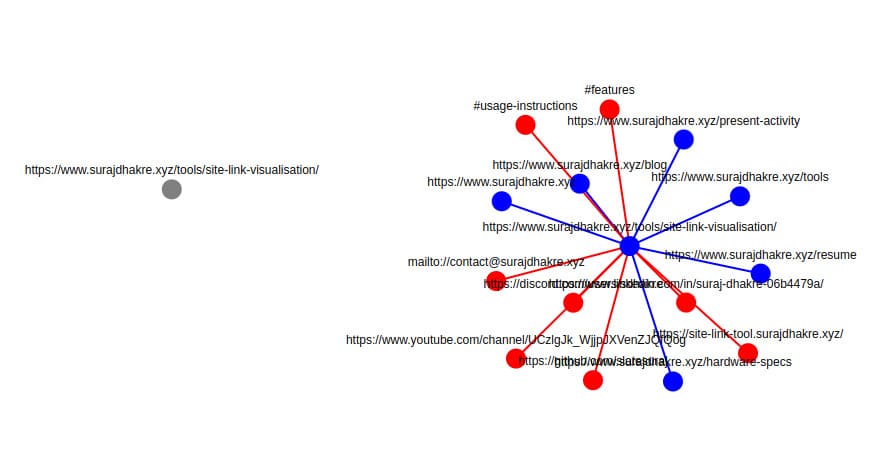
The Node Connectivity Graph is a web-based visualization tool built using D3.js. It allows users to visualize and interact with nodes and links representing internal and external connections of a given URL. The graph is dynamically generated and responds to user input, such as clicking nodes or resizing the window.
Demo - https://site-link-tool.surajdhakre.xyz/

Features
-
Dynamic Graph Visualization
- Displays nodes (URLs) and links (connections) in a force-directed graph.
- Nodes are categorized into internal and external links with distinct colors.
-
Interactive Controls
- Users can input a URL in the search box to plot its connectivity graph.
- Clicking on an internal node fetches and adds its connections to the graph.
-
Responsive Design
- The graph adjusts its size dynamically to fit the screen resolution.
- Nodes are confined within the visible area for better usability.
-
Enhanced Usability
- Text labels are non-selectable, ensuring smooth node dragging.
- Nodes and links are draggable for exploration.
Usage Instructions
- Open the HTML file in a browser.
- Enter a valid URL in the search box and click “Submit.”
- Explore the graph:
- Drag nodes to rearrange them.
- Click on internal nodes to fetch and display their connections.
- Resize the browser window to see the graph adjust dynamically.
Note: The tool may not work for some website due to bot protection.
Note: Please use it responsibly.
The Node Connectivity Graph provides an interactive and visually engaging way to explore URL connections. With responsive design and dynamic updates, it serves as a robust tool for web structure analysis and visualization.